📖Definition
Data Tables and Pictograms are ways of organising data that make information easy to see.
Data Tables use numbers to show the information, Pictograms use symbols.
Method
There's nothing too difficult about these. It's a matter of reading the information in the diagram carefully and then using it to answer the question.
Data Tables
The table below shows the results of a door-to-door survey conducted on a particular street to find the number of pets per house.
Diagram
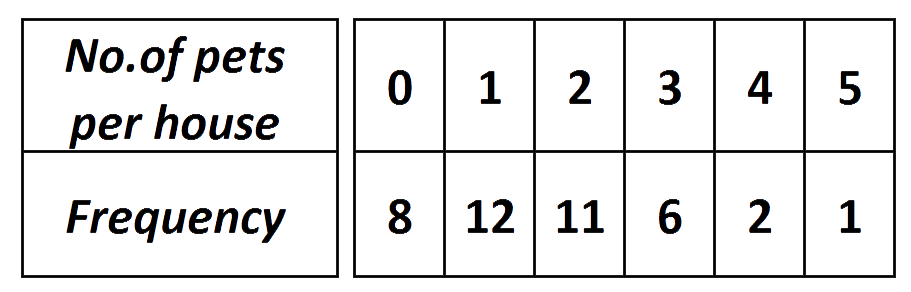
It's easy to see that 11 households had 2 pets, but only 1 household had 5 pets.
Data tables can be used to calculate various statistics (see worked example below).
Pictograms
A pictogram is simply a way of portraying data using pictures.
Usually a relevant symbol is used to represent the frequency of a particular item.
Eg a single car symbol might represent 10 motorists. A symbol of a raindrop might represent 5 cm of rain.
Diagram
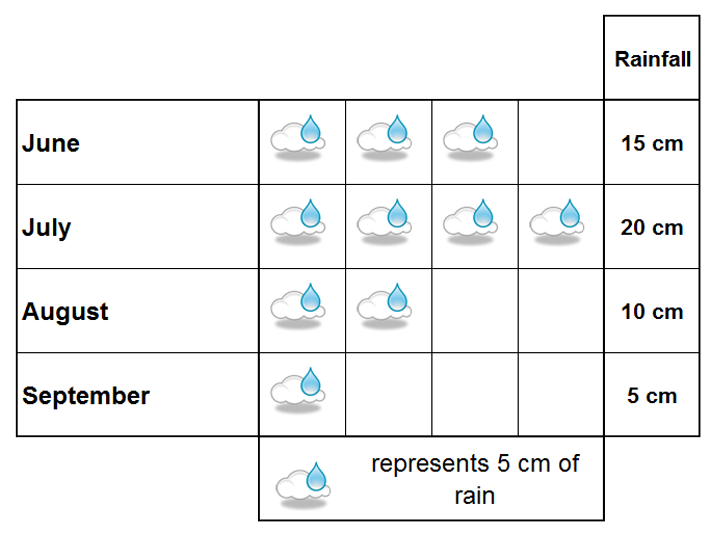
If you're reading data from a pictogram, don't forget to look at the key. This will show you what the symbols represent.
✏️Example
This pictogram shows the number of pizzas sold each night in a restaurant during a week.
How many pizzas were sold on Wednesday?
Diagram

✅Solution
1 whole pizza icon represents 10 pizzas sold, so 1/2 an icon represents 5.
Wednesday has 2 1/2 icons so that's 20 + 5 = 25 pizzas.
✏️Example
Sally's school football team went on a summer camp for a week. They played matches every day and Sally kept a record of the number of goals the team scored and put it in the table below.
Diagram

Use the table to find the mean, median, mode and range of the number of goals scored per day.
For the mean, add the entries in the right hand column: 3 + 5 + 7 + 7 + 10 + 4 + 6 = 42
There were 7 days so the Mean = 42/7 = 6 goals.
The Median is the Middle Value.
Write the seven entries in the right hand column out in numerical order starting with the smallest:
3, 5, 5, 6, 7, 7, 10
The Median is the 4th value along ie. 6 goals.
The Mode is the value that occurs most often in the right hand column ie. 7 which appears twice.
The Range is the difference between the highest and lowest entries in the right hand column ie. 10 - 3 = 7